Prefer to view this content on our website? Click here.
Dear Fellow Investor,
How to Know When Volatility Will Pivot
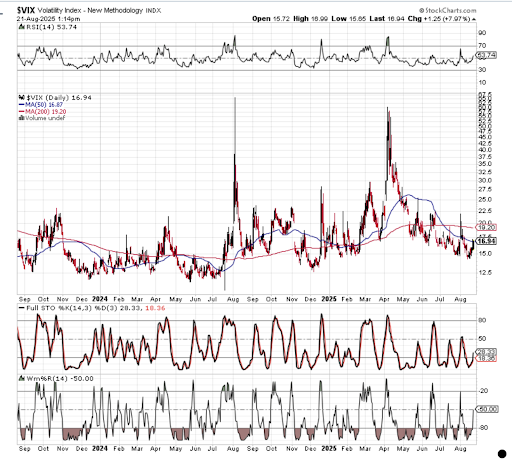
Market volatility can be intimidating. Sudden swings in the S&P 500 or Nasdaq often leave traders scrambling, wondering whether it’s the start of a new trend or just another head fake. But there’s one powerful tool that can help make sense of the chaos: the Volatility Index, or VIX.
Often called the “fear gauge,” the VIX measures expected volatility in the market based on options activity in the S&P 500. When fear spikes, so does the VIX. And when complacency takes over, the VIX drifts lower. For investors and traders alike, knowing how to interpret these movements can make the difference between catching a profitable reversal or being caught on the wrong side of a move.
The Importance of Spikes in the VIX
One of the clearest ways to spot potential reversals is by paying attention to unsustainable spikes in the VIX. When panic sets in and investors rush to buy options for protection, the VIX can surge to extreme levels. Historically, those moments of panic often mark short-term bottoms in the stock market.
For example, during the COVID-19 market crash in March 2020, the VIX soared above 80 — a rare and extreme reading. Shortly after, stocks bottomed out and began a massive recovery. More recently, spikes above 35–40 have repeatedly signaled moments when fear became overblown, followed by relief rallies.
But how do you know when a spike has truly reached “unsustainable” levels? That’s where technical indicators come in.
Eagle Financial Publishing
The Most Valuable Material On EARTH (...it's not what you think)

1200X more valuable than silver... 32X more valuable than platinum... And 16X more valuable than even gold! Today, anyone can tap into the extreme wealth about to be unleashed only if they know this one special investment.
Click here for all the details.
Three Key Indicators to Watch
When studying the VIX, there are three technical tools that can help confirm potential turning points:
-
Relative Strength Index (RSI)
-
The RSI measures momentum on a scale of 0 to 100. Readings above 70 indicate overbought conditions (too hot), while readings below 30 suggest oversold conditions (too cold).
-
When the VIX spikes and its RSI pushes above 70, it’s often a sign that fear has reached an extreme.
-
Williams’ %R (W%R)
-
This oscillator ranges from 0 to -100 and highlights overbought or oversold conditions. Readings above -20 suggest overbought levels, while readings below -80 point to oversold.
-
In the case of the VIX, a push above -20 often coincides with emotional panic in the markets.
-
Full Stochastics
-
Another momentum indicator, the Full Stochastics compares closing prices to price ranges over time. Readings above 80 suggest overbought territory, while readings below 20 highlight oversold conditions.
-
When the VIX’s Full Stochastics climbs above 80, it’s a strong confirmation of excessive fear.
When all three indicators align in overbought territory, history shows that the VIX is likely near a short-term peak — meaning stock market volatility could soon cool, and equity prices may stabilize or rally.
Spotting Reversals in Both Directions
The same process can also work in reverse. While panic-driven VIX spikes tend to mark bottoms in the stock market, periods of complacency and low volatility can warn of potential market tops.
To identify these moments, look for:
-
RSI dipping near or below 30
-
Williams’ %R falling below -80
-
Full Stochastics sliding under 20
When all three indicators align in oversold territory, it signals that the VIX has gotten too quiet, too calm — which often sets the stage for an uptick in volatility and possible downside in stocks.
Think of it like a pendulum: the market swings between fear and greed. Extreme fear can be a contrarian buy signal, while extreme complacency often warns of trouble ahead.
Does This Work Every Time?
No system is perfect, and this method is no exception. Sometimes, the VIX can remain elevated for longer than expected, or remain low during extended bull markets. But historically, watching these indicators together improves the odds of spotting key turning points in market sentiment.
Instead of guessing when volatility might pivot, you’re relying on a combination of proven momentum tools. Over time, that consistency can help you avoid costly mistakes and capitalize on market extremes.
Crypto 101
The $50B milestone that signals altcoin season is here
Something massive just happened while everyone was watching Bitcoin at $120K…
A leading DeFi project just smashed through $50 billion in Total Value Locked—an all-time record that puts it ahead of most traditional financial institutions.
But here's the real story: This happened while Bitcoin dominance crashed to a 4-month low of 60.9%.
The altcoin season index just crossed above 50 for the first time since December, and this protocol surged 20% in a single week as capital rotates from Bitcoin into DeFi powerhouses.
Think about it: $50 billion in TVL means this protocol is managing more assets than most major banks.
Yet it’s still super underpriced compared to its insane value…
When altcoin season fully kicks in—which the data suggests is happening RIGHT NOW—this project is poised to see massive moves....
Discover the protocol that’s quietly replacing traditional finance.
Bonus: Chart of Day
UnitedHealthcare (SYM: UNH) is one of the most dominant companies in healthcare. Yet, it’s trading at its cheapest price in years.
Even better, Warren Buffett’s Berkshire Hathaway, which built up its largest cash stockpile in years, reaching $347.7 billion in the first quarter of 2025, just bought 5.04 million shares of UNH for $1.57 billion.
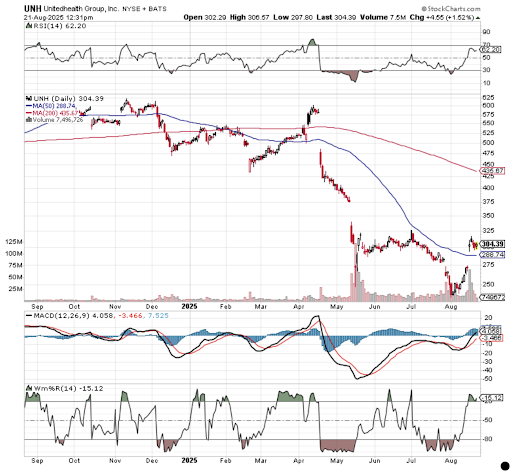
Typically, when Buffett’s Berkshire Hathaway buys a stock, it can lead to increased investor confidence and potentially higher stock prices due to the reputation of the firm and the longstanding belief that Buffett buys quality stocks at a quality price.
UNH is also trading at 13x earnings, which is about 49% lower than the sector median. Its price-to-free cash flow ratio (P/FCF) of about 10 is also below the sector median of about 14.5. In addition, at 13x earnings, UNH now trades at a substantial discount to the S&P 500’s P/E ratio of 29.76. In short, it’s inexpensive with historically low valuations.
Are there any other technical indicators do you rely on to time your trading? Are there any specific sectors of the market you think areon their way up right now? Hit "reply" to this email and let us know your thoughts!

No comments:
Post a Comment