Tuesday, April 8, 2025

Why the Markets Really Went Down (And Why They Will Bounce)

Shield

AN OXFORD CLUB PUBLICATION

Loyal reader since December 2024

Wealthy Retirement

SPONSORED

He Picked Apple at $1... and Netflix at $2... Now He's Invested $100K Into This $5 AI Stock

Alex talking outside
 

CLICK HERE TO FIND OUT WHAT IT IS

Editor's Note: With new tariffs rattling global markets, many investors are scrambling for answers.

But our partners at TradeSmith recently discovered a tool that pinpoints the biggest stock moves up and down on 5,000 stocks, to the day, with 83% backtested accuracy...

That's why TradeSmith is hosting a Breakthrough 2025 Emergency Summit this afternoon at 1 p.m. ET.

The event is entirely free to attend.

Simply reserve your spot – and begin "beta testing" TradeSmith's breakthrough tool - here.

In a market full of uncertainty, 83% backtested accuracy could be a godsend for investors.

- Rachel Gearhart, Publisher

Why the Markets Really Went Down (And Why They Will Bounce)

Marc Lichtenfeld, Chief Income Strategist, The Oxford Club

Marc Lichtenfeld

Your last name doesn't have to be Einstein or Buffett to understand that the markets nosedived last week on news that the U.S. would impose tariffs on all foreign goods.

Consider:

  • The new tariffs are the largest tax increase since 1968.
  • It is estimated the tariffs will boost inflation by 1% to 1.5%.
  • The average family will see a $3,585 increase in their costs.

It's no wonder the markets tanked.

Had a sensible tariff system been designed by the top minds in Washington (an oxymoron), the market still would have sold off, but perhaps not the gut wrenching drop we experienced.

Instead, I believe the market was responding not only to the economic pain the tariffs will cause but also to the reckless way they were formulated. The actual tariff rates that nations charge each other are difficult to calculate because various goods have different tariffs on them. Rather than do the math to ccalculate a figure that each country charges, the U.S. created a simple, nonsensical formula to arrive at its tariff figures.

Here's the new formula:

Chart: American's New, Nonsensical Tariff Rate Formula
View larger image
 

So, if a company exported $50 billion to the U.S. and imported $25 billion, the tariff rate would be 50%. Because 50-25 divided by 25 = 1. 1 times ½ equals 0.5 or 50%.

Even if the country had no tariff on U.S. goods, U.S. importers (and ultimately consumers) would have to pay a 50% tariff.

That makes no sense.

SPONSORED

Trump's Secret Weapon:
'Document 20' Unleashed

Trump in office
Source: Wikimedia Commons

A explosive document written by Trump could send the Dow soaring to 75,000.

Top analyst reveals details on which stocks might surge during the second Trump Stockwave.

Click to see the details before it's too late.

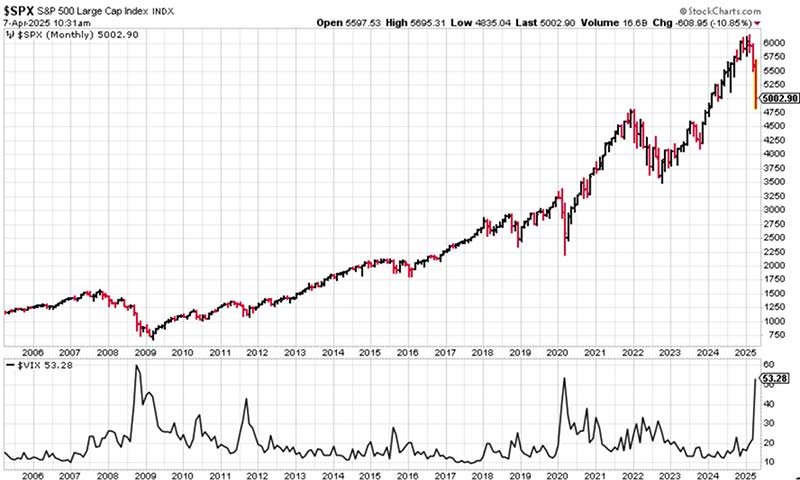
Policy makers appeared to have done their best imitation of an 11th grader the night before term papers were due and simply asked Chat GPT for a formula.

On top of the harebrained formula tariffs were also levied on land masses that have no people on them.

Understandably, the markets have lost confidence that this administration is capable of improving the economy.

So why do I believe the markets will bounce?

We know that President Trump is a force of nature who usually gets his way. Taiwan has already said it would consider removing tariffs against the U.S. Just prior to April 2, when President Trump revealed the new tariffs, Israel removed all tariffs against American goods.

If other countries come to the negotiating table and the situation gets diffused, the market will likely rally hard.

The president has also been known to change his mind. Facing increasing backlash from the public and the markets, he could shift his position. In fact, yesterday morning, the market ripped higher for about 15 minutes on a report that he is considering pausing tariffs for 90 days.

Lastly, investor sentiment is extremely bearish, which is usually a sign that a bottom will occur soon.

The VIX, a measure of volatility, hit an 18-month high of 60. VIX readings above 40, generally indicate panic.

Chart: SPX chart
View larger image
 

This is a 20-year chart of the S&P 500 (top chart) and the VIX (bottom chart). You can see each time the VIX spiked, it led to strong gains for the S&P 500 over time. A spike in the VIX often marks the bottom. It did in 2008/9, 2011, 2015, 2020, and 2022.

Periods of volatility and panic are often the best time to buy stocks because the sellers have sold everything and there's little downside pressure left.

Bear markets, particularly swift ones like this, are brutal. They're awful to go through, but they ultimately end up being great times to add to stock holdings.

There could be some more downside, but I suspect we're not far from the bottom.

Hang in there.

Good investing,

Marc

The BEST WAY to profit from oil is NOT a stock.

Discover the Top Passive Income Opportunity for 2025...

Forget Scanning Stocks. Discover Why Trading 1 Ticker Over and Over Could Have Produced Triple-Digit Gains Week After Week. [Watch Video]

Market Meltdown: Why It's Too Early to Buy the Dip and How to Trade the Chaos

SPONSORED

The #1 Energy Passive Income Investment for 2025

It's not a stock, bond or private company...

But this little-known alternative investment could hand you BIG MONTHLY INCOME from the oil and gas surge in 2025.

CLICK HERE TO FIND OUT WHAT IT IS

No comments:

Post a Comment